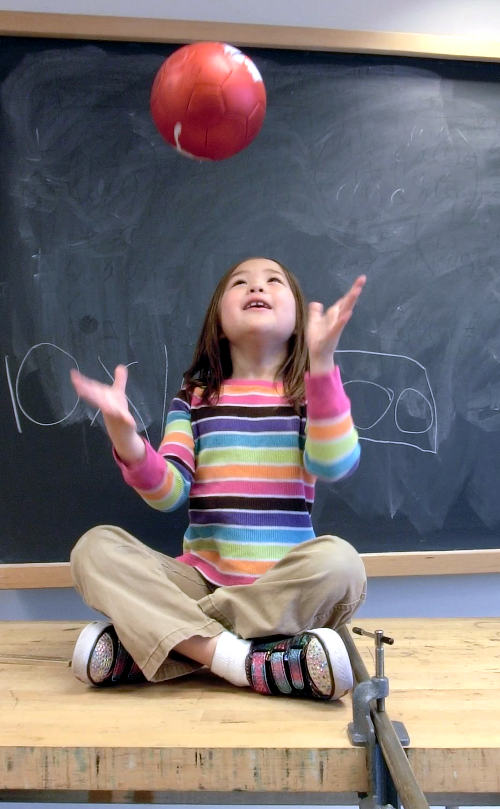
Before going to the playground Saturday to investigate non-intertial frames, SteelyKid and I went over to campus to do some experiments in relativity. Galileian relativity, that is: What you see here is SteelyKid sitting on a rolling lab cart with a camera bolted to it. She throws a ball up in the air a couple… Continue reading SteelyKid Demonstrates Relativity
Category: Playing-With-Graphs
Great Moments in Puzzling Axis Labels
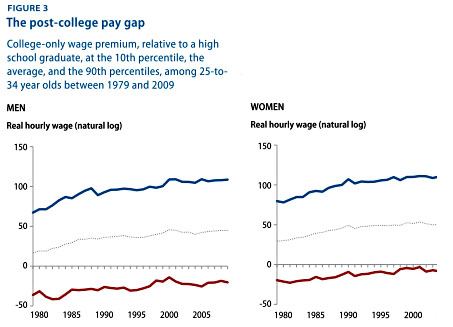
While I’m complaining about statisticulation in social media, I was puzzled by the graph in Kevin Drum’s recent post about college wage gaps, which is reproduced as the “featured image” above, and also copied below for those reading via RSS. I don’t dispute the general phenomenon this is describing– that the top 10% of college… Continue reading Great Moments in Puzzling Axis Labels
String Experiment: Capillary Action is Complicated
As I’ve mentioned here before, I do a lot of work these days in my local Starbucks. This is slightly ironic, as I don’t like coffee– instead, I order tea, which I put in an insulated travel mug. I tend to get the tea, carry the mug back to the table, and let it steep… Continue reading String Experiment: Capillary Action is Complicated
On Computer Color
This year’s “Flame Challenge” is to explain color in terms an 11-year-old can follow. I have opinions on this subject, a background in AMO physics, and access to scientific equipment, so I’m putting something together. In the course of this, though, it occurred to me to wonder how my different portable computing devices process color.… Continue reading On Computer Color
The Evergreen Topic of Grade Inflation
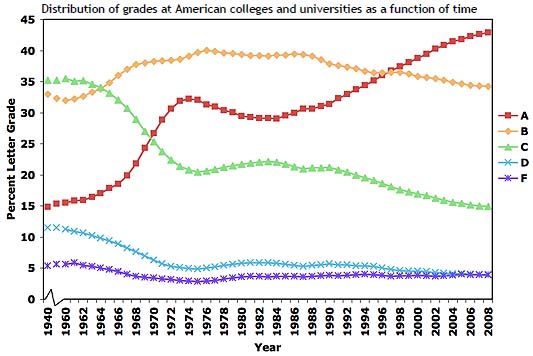
There was a flurry of re-shares last week for this article about Yale shutting down a site that aggregated student course evaluations, which is fine as far as it goes, but repeats a stat that really bugs me: About 43 percent of college letter grades in 2011 were A’s, up from 31 percent in 1988… Continue reading The Evergreen Topic of Grade Inflation
How Fast Should I Drive?
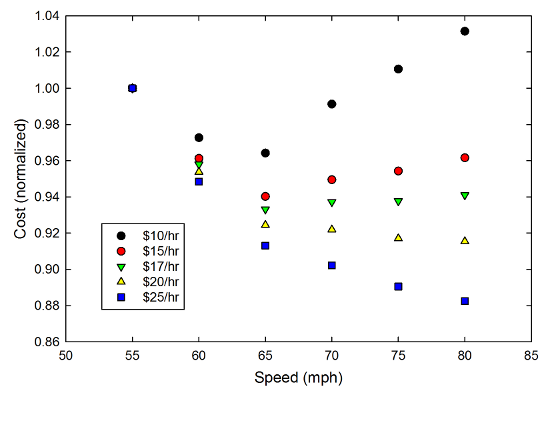
We spent this past weekend in Florida, visiting Kate’s mom and her husband, who moved down there in October. This was a huge hit with the kids, who were very excited to fly on an airplane (four of them, actually, as we changed planes in Baltimore both ways). They also got a big kick out… Continue reading How Fast Should I Drive?
White People Only Have 2.8 Friends
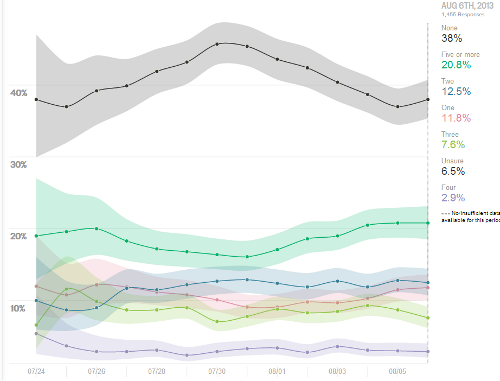
There was some buzz Thursday about a poll showing that 40% of white people don’t have any friends of a different race. Ipsos/Reuters include a spiffy “data explorer” where you can make graphs like the one above. It does not appear to provide an easy way to get at the actual wording of the question,… Continue reading White People Only Have 2.8 Friends
Driving a Simulated Pendulum
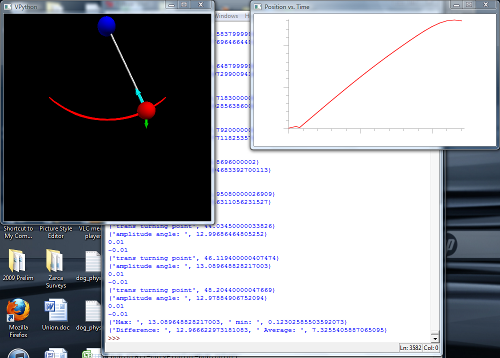
Some time back, I spent a bunch of time writing a VPython program that simulated the motion of a pendulum, which turned out to do some strange things. In the comments to that, there were two things worth mentioning: first and foremost, Arnoques at #5 spotted a small error in the code that fixes the… Continue reading Driving a Simulated Pendulum
Baseball Is Pretty Random
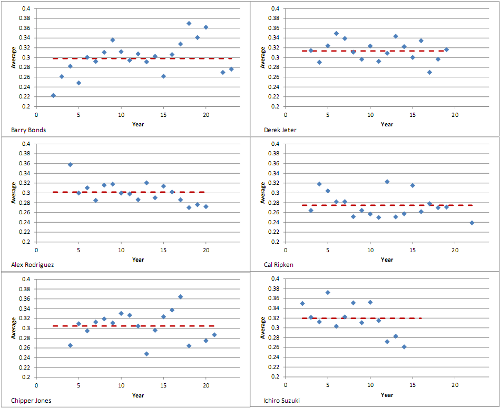
After Thursday’s post about sports and statistics, a friend from my Williams days, Dave Ryan, raised an objection on Facebook: There’s an unstated assumption (I think) in your analysis: that there is some intrinsic and UNALTERABLE statistical probability of getting a hit inherent in every hitter. If that is the case, then yes — a… Continue reading Baseball Is Pretty Random
The Visual Presentation of Misleading Information, Anti-Asian Bias Edition
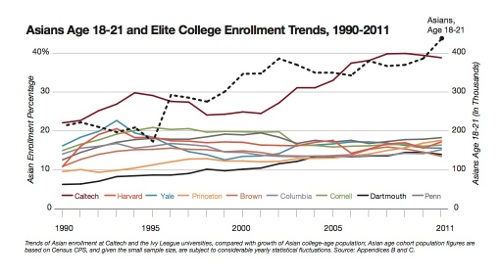
In which the skewing of a data plot in Ron Unz’s epic investigation of college admissions makes me more skeptical of his overall claim, thanks to the misleading tricks employed. ———— Steve Hsu has a new post on a favorite topic of his, bias against Asians in higher ed admissions. This is based on a… Continue reading The Visual Presentation of Misleading Information, Anti-Asian Bias Edition
