In which the skewing of a data plot in Ron Unz’s epic investigation of college admissions makes me more skeptical of his overall claim, thanks to the misleading tricks employed.
————
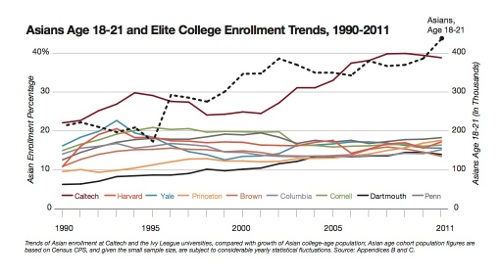
Steve Hsu has a new post on a favorite topic of his, bias against Asians in higher ed admissions. This is based on a giant article by Ron Unz that I don’t have time to read, and illustrated with the graphic that’s the “featured image” for this post (which I will also reproduce below for the convenience of RSS readers).
What does this show? There’s a tangle of colored lines representing the fraction of Asian-American students at the various Ivy League schools over the period from 1990 to 2011, which are mostly clustered in the 15-20% range. There’s also a maroon-ish line representing the fraction of Asian students at Caltech, which climbs from a bit over 20% to just under 40% in the same period.
The argument, here, is that this is damning evidence of quotas for Asian students at elite universities, something Hsu has been talking about for a long time. This is supposed to be clinched by the dashed black line, representing the number of Asians in the general population.

I’m somewhat sympathetic to claims that Asians have a difficult position in higher education, but I hate this graphic as a way of trying to demonstrate it. If you look at it quickly, it seems convincing, but it’s actually doing a couple of sleazy things to over-sell its point, in a way that ultimately makes me less likely to accept the argument it’s supposed to support.
First and foremost, this is comparing apples to potatoes. That dashed black line showing the growth of the Asian population is actually the absolute number of Asian-Americans in the college-age demographic. which means this is a double-y-axis plot, one of the most annoying of all data graphs– I inevitably get turned around as to what data go with what axis, and end up taking twice as long to get the point as I need to. In this case, the dashed line and only the dashed line use the right-hand vertical axis scale, showing the number of Asian-Americans in thousands, while everything else uses the left-hand scale, which is the percentage of Asian-American students at the various universities.
What’s wrong with this? Well, it’s not a fair comparison– you’re comparing a percentage to an absolute number. If the total population of the country were somehow constant, that might be a fair thing to do, but that’s not remotely the case– the population of the US has increased substantially over the last 20 years, from 249 million in 1990 to 309 million in 2010, according to Wikipedia, which is close enough for these purposes. The absolute number of Asian-Americans of college age has gone up, sure, but so has the absolute number of everyone. A fair comparison would need to look at Asian-Americans as a fraction of the population, not their absolute numbers.
Why the incorrect comparison? Probably because it makes for a more superficially convincing graph. Using absolute numbers lets whoever made the graph (Unz or somebody at The American Conservative) adjust the scale so it closely follows the Caltech line– and even goes busting out of the frame of the graph for the last data point, because the Asian-American population is exploding!– while plotting it as a percentage on the same scale as everything else almost certainly wouldn’t produce as close a match. If you scale the Asian-American numbers by the general population increase, the change is more like a 50% increase than the factor-of-two change in the absolute numbers. That’s probably too simplistic, because the Asian-American population might well be increasing faster than other groups, but it gives the general idea.
Along the same lines, plotting the Asian-American students as a percentage of the total on the same scale as everything else would reveal another thing: they’re vastly over-represented relative to their share of the overall population. Asian-Americans are something in the neighborhood of 5% of the total population. The college-age number will be a little different, but not by much– Unz’s epic article has a second graph showing the college-age percentages, and while it’s hard to read, Asian-Americans aren’t even 10%. So, putting the Asian-American fraction on the same axis would mean adding a small line way at the bottom, which would blunt the effect of the graph. And a figure like this is as much an emotional appeal as a rational argument, so drawing visual attention to the fact that even the supposedly quota-limited Ivy League schools enroll Asian-American students at nearly four times their demographic share of the population.
(I’m not saying that Unz or Hsu are trying to conceal the demographic data, here– on the contrary, they’re both very forthright about the fact that even with the supposed quotas, Asian-Americans are overrepresented at elite universities. For conservatives (Unz is, after all, writing in The American Conservative), that’s actually a feature, not a bug– the argument is that Asians deserve to dominate higher education, either due to cultural factors (the tack Unz seems to be taking with his analogies to Jewish quotas in the 20th century) or inherited intelligence (a less common approach, as it easily slips into Creepy Charles Murray territory) that make Asians as a group better qualified than the African-American and Hispanic students who are underrepresented relative to their share of the total population, but get affirmative action preferences that Asian-Americans do not. That’s something spelled out in the text, though, and we’re talking about the graph, which is making a different kind of appeal.)
So, graphing everything as percentages is out. How about normalization, then? That’s a relatively honest approach to comparing unlike things– scale everything so the 1990 data have a value of 1, say, and show the growth since then. That runs into a different problem that’s concealed by the confusing presentation– the fraction of Asian-American students has substantially increased at Dartmouth and Princeton, and not changed much at all for what I think are Penn and Columbia (the muddy Excel color scheme makes it really difficult to trace specific schools through that spaghetti tangle of lines). It’s only Yale, Harvard, and Cornell that show a noticeable decrease in the Asian-American fraction over the period being graphed.
So, a normalized plot would show three lines going down, two going up dramatically (by about as much as the Caltech line), and three not doing much of anything. Again, that would blunt the emotional appeal of the graph. It’s better, for the purposes of the argument being made, to plot them all in a big tangle, which makes it clear that the top line has come down– look! quotas!– but makes it a little harder to see that the bottom line has come up. Conveniently, the two schools that have showed the big increases are also the two smallest Ivies (Dartmouth and Princeton) while two of the biggest (Harvard and Cornell) have come down, so the overall average still shows a decrease, when those numbers are quoted.
Looking closely at this graph, then, gives a somewhat different impression than the first impression it is designed to create. It actually works somewhat against the overall point, because looking at the slightly sleazy way the data are presented graphically makes me more skeptical about the overall argument. If the data were really clear and damning, they wouldn’t need to resort to How to Lie With Statistics graphical chicanery, would they? It might be that the numbers actually back up the story completely, when you go into all the details, but skewing the graphical presentation this way makes me more skeptical than I would otherwise.
In the grand scheme of misleading presentation of dubious data, of course, this isn’t all that bad. It’s not in the same league as Fox News for example– hell, it’s barely even the same sport. This is fairly subtle stuff, subtle enough that it’s even somewhat plausible that whoever put the graphic together didn’t consciously realize they were being deceptive. But the overall effect, on close inspection, is to raise more questions than there are answers provided.
IIRC the total population of college age Americans has not changed very much (say 10% or so) since the 1990s, so the absolute number of Asian-Americans on the RHS is not actually a misleading quantity. It *could* have been misleading (if, i.e., the number of college aged people had increased with the overall US population), but I don’t think it is.
http://www.nsf.gov/statistics/seind02/c2/c2s1.htm
I really think you should read the article (or my updated summary of it, with additional figures) in light of your other comments. The point is, to use Harvard as an example, the population fraction of Asians and the fraction of Asians with top academic qualifications increased significantly since the 1990s, but the Harvard fraction went down. How do you explain that? It looks like de facto quotas to me.
“I’m somewhat sympathetic to claims that Asians have a difficult position in higher education.”
I wonder if you will feel more strongly about this in 10 years when your kids are near college. Will you advise them to not check the Asian box if it decreases their chances?
Looking at the data from that link, I guess it comes down to whether you think the 67% increase in the fraction of the college-age population (from 3% to 5%, according to the source data for fig 02-02) is close enough to the 100% increase in the absolute numbers (guesstimated from the line on the figure, which goes from a bit over 200 to somewhat more over 400) for using the absolute numbers to not be deceptive. That’s a bit more of a difference than I would be happy to wave off, but your mileage may vary.
I agree that if you just look at the Harvard number, it looks bad, but again, Princeton and Dartmouth saw substantial increases in their Asian-American fraction (probably tracking pretty well with the increase in demographic share, actually), so the overall picture is more mixed, even without getting into the rather fraught question of whether there’s a compelling interest in providing access to Ivy-level education for African-American and Hispanic students at the expense of some Asian-American students.
I’d love to be able to read the whole Unz article, but I’ve spent the last half hour drawing up a daunting list of references I need to read for the work-in-progress, to say nothing of the bureaucratic busywork I’m obliged to do in the next few weeks. If I can squeeze it in, I’ll try, but I don’t think I’ll have the time.
Can we also discuss how MIT was left off the chart? Not to mention numerous other “elite” schools (Stanford, Chicago, Duke, etc).
Perhaps top Asian-American students are selecting non-Ivies in much larger numbers for whatever reason. Or is this analysis specifically saying that the Ivies are perpetuating this discrimination? (Sorry I didn’t read all links.)
Even if you think that there are compelling reasons to *limit* the number of Asian-Americans at Harvard (perhaps in favor of other groups), the reality is that most people are unaware that this is going on.
As a physicist, perhaps you can explain the strange convergence of Asian percentage at about 15% at all of the Ivies, while schools with race-blind admissions like Berkeley and Caltech have seen huge increases in their percentage. If it’s not active intervention, then what is it?
Also (sorry for the double post) shouldn’t we be looking at acceptance figures for these schools and not enrollments?
Quotas should be evident the acceptance numbers without having to consider other factors (say, increased focus on recruitment of Asian-American students by non-Ivy schools, like southern school where Asians have long been severely under-represented).
Our kids will describe themselves however they feel best suits their own sense of self, and I don’t think there’s anything more to be said on the subject.
@andre: Given that there are eight Ivy League universities, the chart is already quite busy, so I don’t blame Unz for choosing only one “control” school. However, I do question his choice of Caltech as the control, since they focus on science and engineering more heavily than the Ivies typically do. There would be a similar issue with comparing against MIT. Stanford might be a reasonable choice. But I think a flagship state university–Michigan, for instance–would make a better control.
The Ivies have a strong degree of overlap in their applicant pool, such that many students accepted at one of those schools will also be accepted at other Ivies. MIT and Stanford also have substantial overlap with this pool. So I think enrollments are a better choice, to avoid double-counting.
Kate said most of what needs to be said about the checking of boxes. I’ll say more about that and other aspects of this whole in a post tomorrow (assuming I have time to write it).
As to what may or may not be going on with Harvard admissions, the whole admissions process is one of those sausage-making endeavours where you don’t really want to know all the details of what’s going on. It’s probably the case that they’re targeting a class that’s around 15% Asian-American, but there are lots of processes that might end up giving that sort of result– targets for geographic distribution, socioeconomic factors, legacy and athletic preferences– without being a real quota. It’s a mess.
It’s probably possible to sort some of this out by digging into the numbers, and maybe Unz has. The point of this post, though, is that the slightly shady way this graphic was put together makes me much less willing to just accept his conclusions than I might otherwise have been.
> Or is this analysis specifically saying that the Ivies are perpetuating this discrimination? (Sorry I didn’t read all links.)
Andre, yes; Unz specifically discusses Caltech and MIT as meritocratic places which show increasing Asian inclusion contra the Ivies and especially Harvard.
Well, there should also be some geographic adjustment. There are six million Asians in California, 300,000 in Massachusetts, so the Harvard – CalTech comparison is particularly skewed.
As you noted, you can “prove” anything if you float the scale on the right for only one of the curves, as was done in making this graph.
For example, you could change the scale so the Asian college-age population would roughly follow the Dartmouth line (which more than doubles over that time period) and imply that the other Ivy League schools were favoring Asians in their admission policies.
“For example, you could change the scale so the Asian college-age population would roughly follow the Dartmouth line”
Because everybody knows Dartmouth is so much more important than Harvard, Yale, or Princeton.