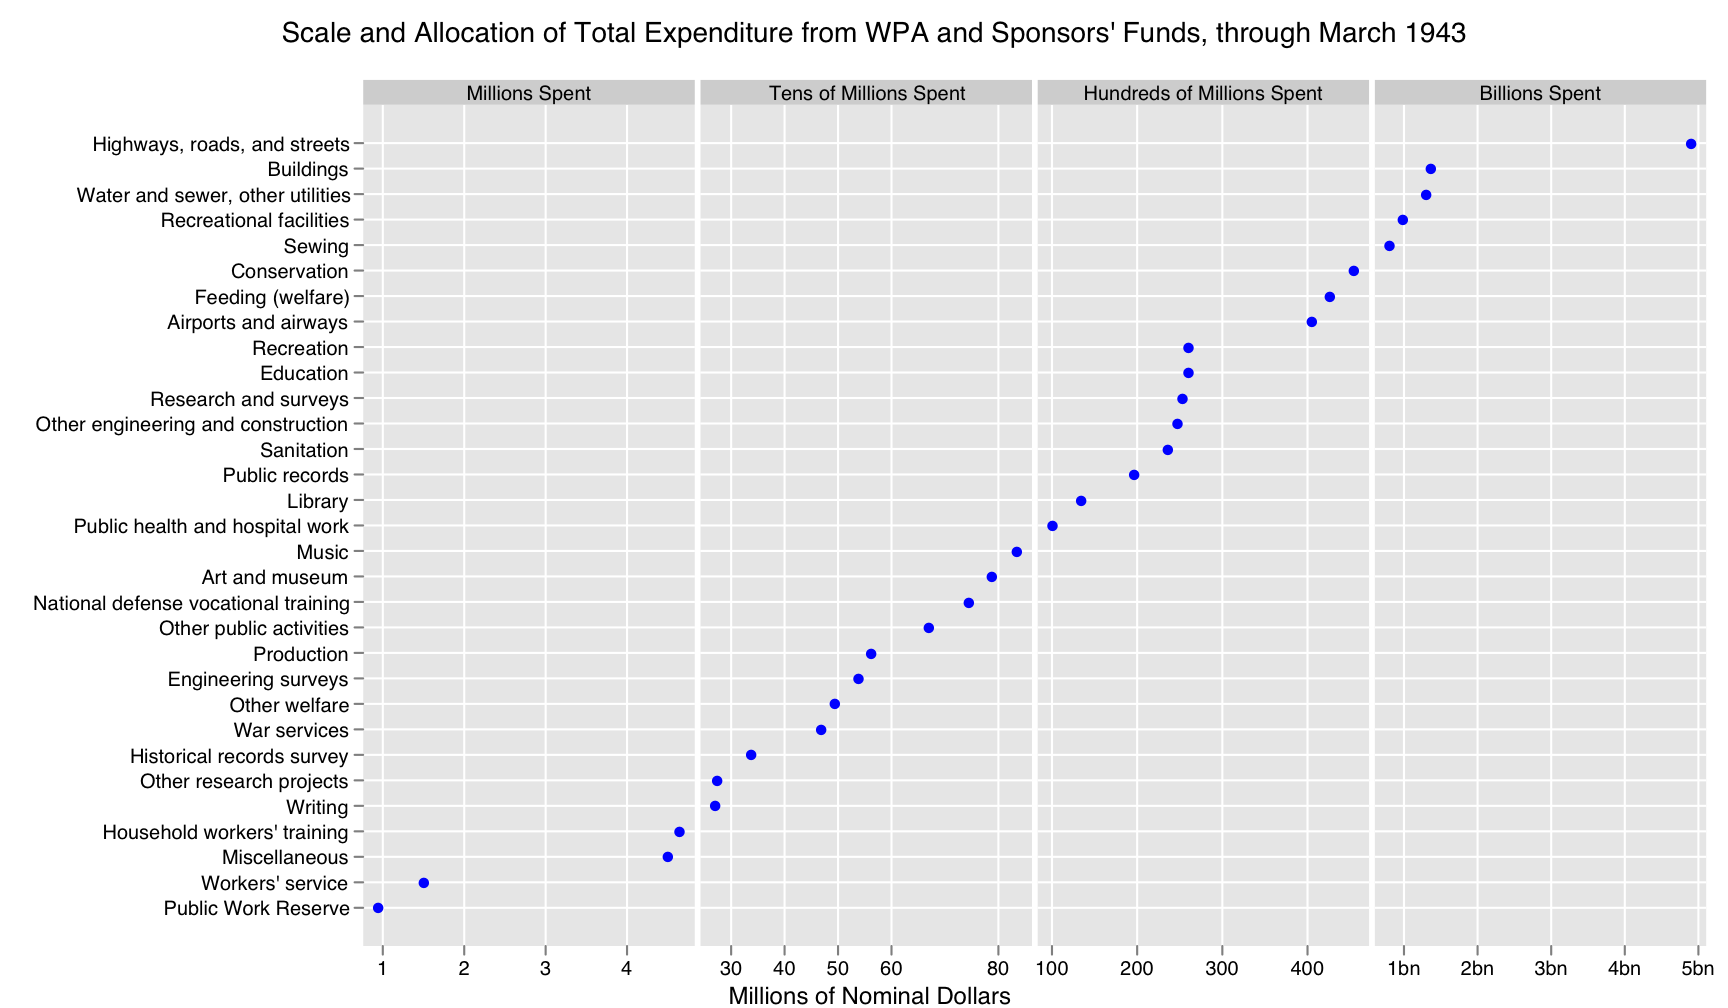
A couple of smallish items that came up in recent days, that can be grouped together under the general heading of “data presentation oddities.” First, over at Crooked Timber, Kieran Healy tries out a semi-hemi-demi-log plot for a graph of WPA expenditures.
The problem he’s trying to address is the gigantic difference in magnitudes between the billions spent on road construction and the mere millions spent on public art. His solution is to split the chart into regions corresponding to different orders of magnitude. They’re each graphed linearly, but there’s one section for millions, another for tens of millions, a third for hundreds of millions, and a fourth for billions. The large-size plot is here— it’s big enough that I don’t want to edit it down to post it here.
It’s an interesting attempt. I’m not sure it’s entirely successful– now that I look closer, the individual sections are scaled somewhat oddly, and it takes a minute to figure out what’s going on. It’s probably more comprehensible than a log plot, though, and comes close to the goal of showing the full variation within categories, while also making clear that construction spending dwarfed everything else. It’s a useful corrective to the idea that the WPA was all about paying pinko artists to write plays, or some such.
(OBPersonalHistory: the junior high school I attended was built as a WPA project. The flood control dam in town is also a Depression-era project, though I’m not sure if it was funded by one of the NEw Deal agencies, or by the Army Corps of Engineers (who currently maintain it).)
The other data presentation oddity comes from the Freakonomics blog, where Justin Wolfers is talking about measures of happiness. He posts a big graph to show that measured happiness is on the decline. At least, that’s what his point is supposed to be– my first thought looking at it was “Whoa! Freaky digitization errors!”
The problem is, as explained in an earlier post, he’s using polling data from Gallup that has been rounded to the nearest integer, but plotting it on a scale that’s fine enough to show much smaller changes. As a result, the graph on the finest scale shows discrete steps of 2, 3, 4, or 5 percent. Plotting the data as a line with no visible data points makes it look distractingly freaky, at least to my eye– lots of perfectly flat stretches, punctuated by perfectly triangular spikes up or down.
I’m not sure what the solution to this is, other than getting Gallup to give out numbers with one more significant digit, which probably isn’t going to happen. Binning the points a little more coarsely would probably work– it already claims to be a three-day moving average, so plotting a third as many points would be a reasonable compromise, I think.
Unrelated to the plotting issues, I would also object that the category names are a little tendentious. People who rate their happiness as 7/10 or higher, and expect to be 8/10 or higher in five years are termed “thriving,” while those who rate their happiness 0-4 and expect to be in the same range five years from now are “suffering.” I’m mostly ok with those, but then they term the remainder “struggling.” That seems a little loaded, especially given the broad range of possible states that would land you in that category.
For example, a thesis-writing grad student might reasonably deem their current happiness level to be a 3, but expect to be an 8 five years hence, in their first tenure-track job. I don’t think that could reasonably be called “struggling.” Overly optimistic, maybe, but not “struggling.”
He’s perfectly correct to point out that people appear to be moving from the top category into the middle category, but the situation would sound much less dire if the middle category were called something less charged than “struggling.” Which is picking semantic nits, granted, but it bugs me all the same.