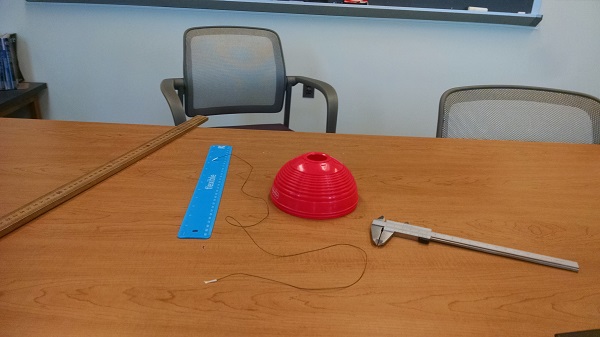
A couple of times last week, I mentioned on Twitter that I was going to demonstrate relativity with toddler toys and string. This was an inspiration that hit late on Thursday, when I was trying to think of a better way to explain embedding diagrams (the technical term for those stretched-rubber-sheet pictures that everybody uses to illustrate general relativity).
Specifically, I was hearing a lot from students who didn’t understand the point of what was supposed to be weird about those. So I was trying to think of how to do a demo, when I realized we could measure the change in geometry that comes with a curved surface using the plastic stacking hemispheres that SteelyKid and The Pip have now outgrown.
The idea is to show how distance measurements on a curved surface change basic facts about geometry. So I had the students experimentally determine the “value of π” for different points on the hemispheres. The ones we have have lots of little ridges, that serve as convenient places to wrap string around, so I gave a half-dozen groups of students each a hemisphere, a length of string, and a plastic ruler. I asked them to measure the circumference at three different points, by wrapping the string around one of the ridges and measuring the length of string needed to go around. Then I asked them to measure the “diameter” along the surface of the sphere, by stretching the string across the top, from one side to the other.
I did the same thing after class, with the addition of a pair of calipers borrowed from the teaching labs, which I used to measure the actual diameter of the ridge in question. The results make this graph:

As you can see, for points near the top of the sphere, where the string over the top doesn’t experience much curvature, the value is fairly close to the expected value of π. As you go farther out, though, the ratio drops significantly, getting down toward 2 (which you can easily convince yourself is the correct answer for a perfect hemisphere). The measurements using calipers are all a bit high for π (probably because the pinch-the-string-at-the-right-length measurement isn’t all that precise), but basically constant as you go out.
The point here is that the curvature of the surface changes the apparent value of π because the distance you measure over the curved surface is longer than the “real” distance between the opposite sides of the circle. This is the point of the stretched-rubber-sheet stuff in General Relativity– the way you measure distance changes as you get near a massive object, compared to the standards of a distant observer in flat space, and as a result you see longer distances than you expect.
This, of course, was a nice lead-in for a quick mention of the Viking Relativity Experiment, which did exactly this sort of thing by tracking radio signals between Earth and the Viking probes on Mars. They saw a significant delay compared to what you would expect from the orbital parameters when the signals needed to pass close to the Sun, which is a result of the bending of spacetime in exactly this sort of manner.
I’m not sure how much difference this will really make in terms of students understanding and appreciating spacetime curvature, but it went surprisingly smoothly in terms of getting the measurements done, and showing the desired pattern of variation. So, yay for last-minute inspiration, toddler toys, and string…

I suspect that they will learn a lot from this, although I’m not sure how to assess their understanding of curved space and curved space-time. Did you mention that the earth is curved, hence the relevance of “great circle” routes as the shortest distance between two points, or the fact that parallel lines will eventually meet?
I suspect that New York was surveyed in a haphazard fashion because it was settled along rivers and around lakes and mountains long before there was any organized system, but you can find some clear indications of the earth’s curvature in the mapping of states that were surveyed into townships and sections when they first became territories.
In the latter case, you ought to be able to find topographic maps or even county maps that show the correction line required so that sections remain approximately a mile square. N-S roads have an unexplainable jog every six or twelve miles. The effect is clearest if the area you are looking at is far enough north and some distance from the meridian used as the east-west centerline.